Blah blah briefing of the
textile and apparel sector
How the sector can meet its climate goals
Nov 2021
Nov 2021

Briefingpurpose
This briefing document aims to make the
solutions for climate change real.
Often action related to climate change tends
to get diffused. That is especially true of the
textile an apparel sector, whose value chain
employs 100s of millions of people in almost
every country in the globe.
This briefing note provides a framework to
analyzes the entire production and brings
granularity on the key levers to move.
This document has been produced by the
Sustainable Industries practice at cKinetics.
About the title
The title of this document was inspired by Greta
Thunberg’s address at the Youth4Climate in Sep
2021. Her message was that that there has been
lots of talk (blah blah blah) and little action.
This briefing document is based on the analysis
of commitments (talk) of several hundred
players in the textile and apparel sector. And
tracks the impact, assuming they get converted
to action
Almost1/10
th
ofman
madeemissions
The textile and apparel sector touches every aspect of our
daily lives. Their production and sale, generates 2.5 billion
tons of greenhouse gas emissions annually.
The sector’s emissions are increasing in absolute terms; as
well as a percentage of global emissions. It represents 7.25%
of total man-made emissions presently and is expected to
reach 9.5% by 2030.
The increasing use of polyester is perhaps the single biggest
factor. This briefing will touch upon other drivers as well.
Summary
2465
Million
tons of
greenhouse
gases
80
Million
Tons of fiber
converted to
products
7.25
Percent
of mankind’s
annual GHG
emissions
641
34
3.1
Percent
annualized
consumer
demand growth
395
Million
People
employed by
the sector
Webof
impactof
textileand
apparel
sector
Million
tons influenced
by 165
companies
165companiesinfluence
24%oftheemissions
cKinetics conducted a study to analyze and trace the
emissions of the sector. 165 companies across the globe and
across the production value-chain (from fiber all the way to
product) generate and influence 608 million tons (or about
24% of the sector emissions).
56companiesplanning
emissionsreduction
Many of the companies have set goals and shared details on
them. All this has happened within the last 3 years. It is likely
that this trajectory will continue, especially after factoring in
various national climate pledges.
Tracking action over the next few years will be critical.
Percent
of large companies
that have emission
reduction goals
Howtovisualizeis1billion
tons?
All people on earth weigh 0.5 billion tons
Global plastic consumption is 1 billion tons
Global annual consumption of meat is 0.3 billion tons
Global annual fiber that we convert into products is 0.1
billion tons
These are the emissions generated in the making
of textile and apparel products that we consume
Whatkindofproducts
generateemissions?
Our daily lives are intertwined with textile and apparel
products. From the moment we wake to the time we go to
bed, we use them all the time.
Just consider some examples: the bed we have slept on
(sheets, pillows, mattresses), the towels we have used, the
clothes we adorn ourselves, the seats of the vehicle we use
to commute, napkins we use at our meals, etc.
We also see textiles in packaging (container bags),
agriculture (mats, crop-covers, nets), building construction,
hospitals (masks, gowns, gauzes), etc.
Emissions are generated in the manufacturing process that
covers:
1. Making (or growing) the fiber
2. Converting the fiber into yarn
3. Converting the yarn into fabric
4. Shaping the fabric into the final product
2.465
billiontonsofCO2e
peryear
395
Millionpeopleemployed
acrosstheglobe
Economicimpactishighest
inemergingcountries
The sector also tends to be a large component of the GDP in
several emerging markets.
In many cases, it tends to be the dominant manufacturing
sector- providing higher income opportunities than those
otherwise available.
Textile and Clothing (% of manufacturing sector)
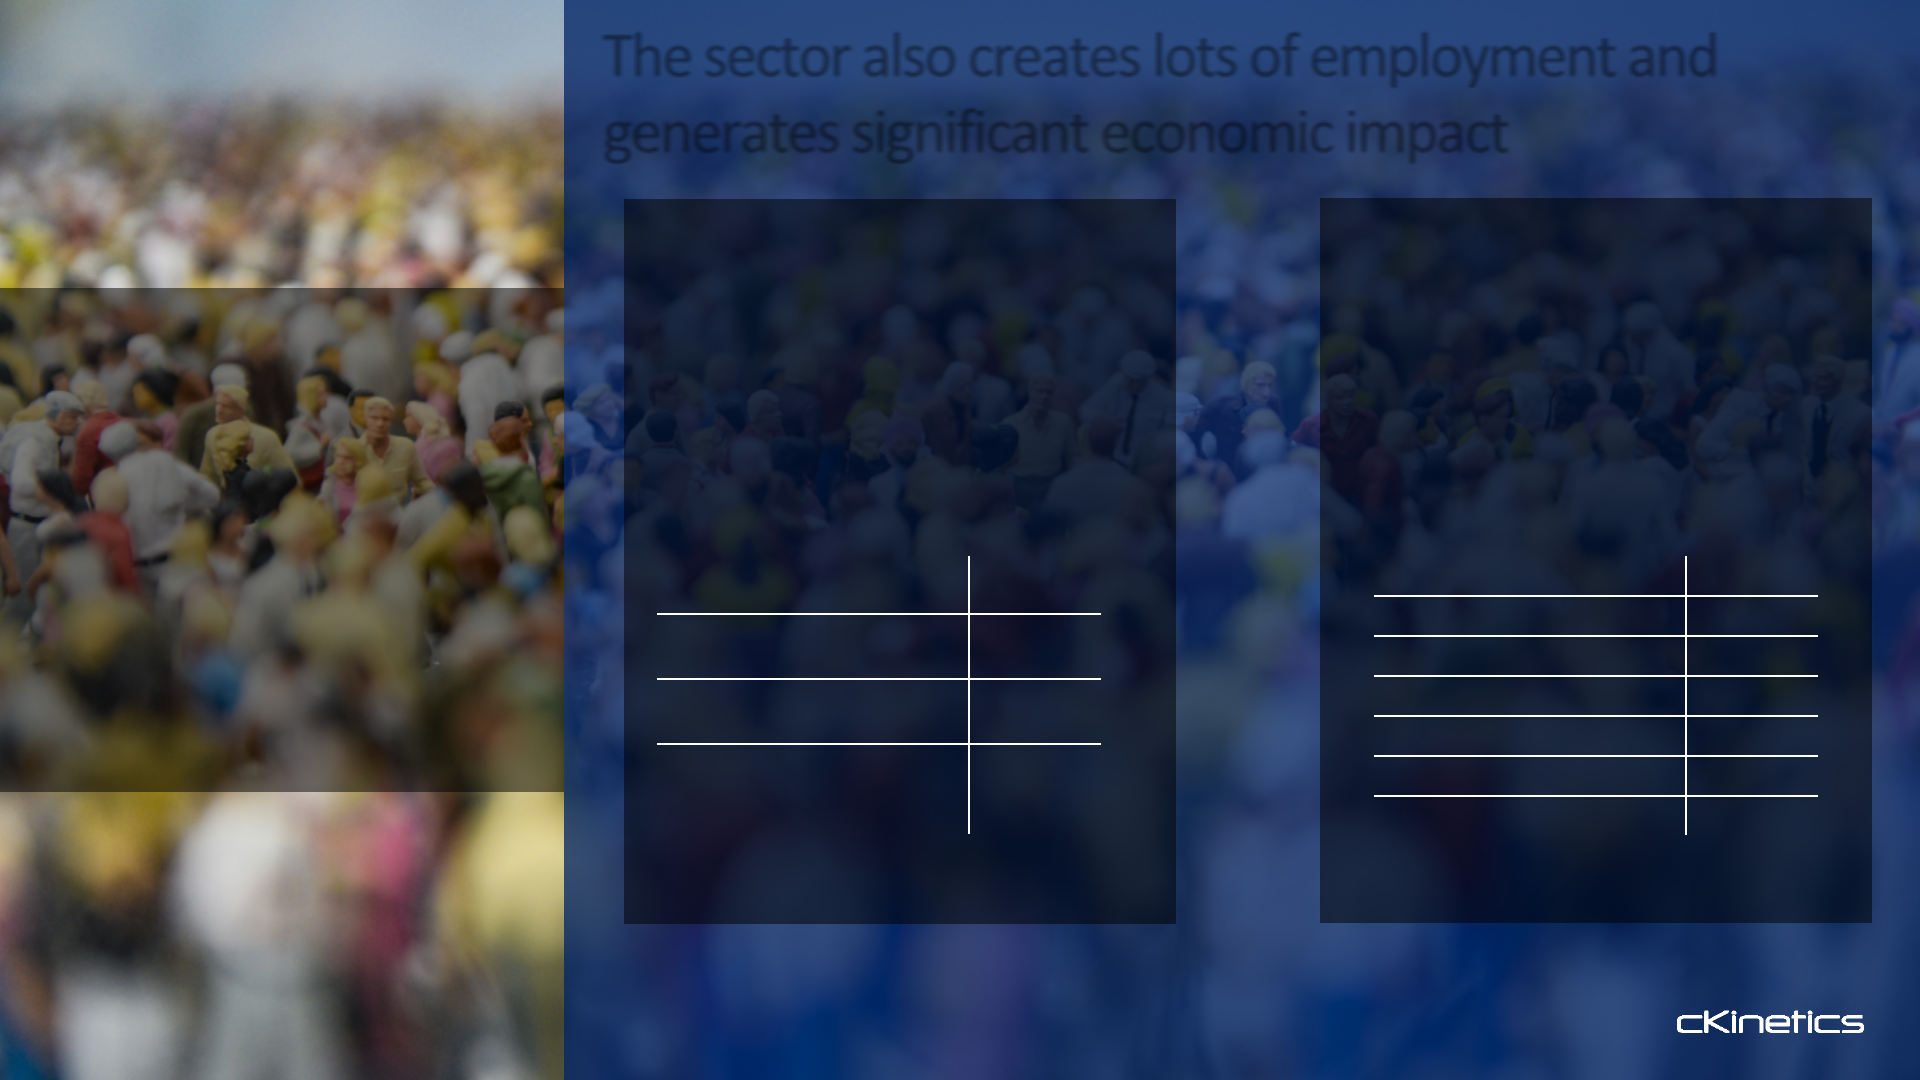
The sector also creates lots of employment and
generates significant economic impact
Employmentacrossa
varietyofvocations
The textile and apparel sector has a long value chain that
touches a variety of different vocations. In many countries it
tends to be one of the larger employers.
And in sub-segments like cut-sew the employment is
dominated by women.
Estimated global employment (in millions)
Farmers and fiber preparation 300
Industrial workers (chemicals,
mills, man made fiber, etc)
20
Cut-sew-make (textile and
apparel)
75
Store workers (whose work
cannot be attributed to the
textile and apparel sector alone)
100
Cambodia 87%
Bangladesh 51%
Sri Lanka 32%
Pakistan 29%
Honduras 22%
Vietnam 16%
Guatemala 11%
Source:UNFashioncharter,ILO,Fairtrade,NationalRetailFederation Source:WorldBank.UnitedNationsIndustrialDevelopment
Organization,InternationalYearbookofIndustrialStatistics.
Billions
1975 1980 1985 1990 1995 2000 2005 2010 2015 2020 2025 2030
0
5
10
15
20
25
30
35
40 20%
18%
16%
14%
12%
10%
8%
6%
4%
2%
0%
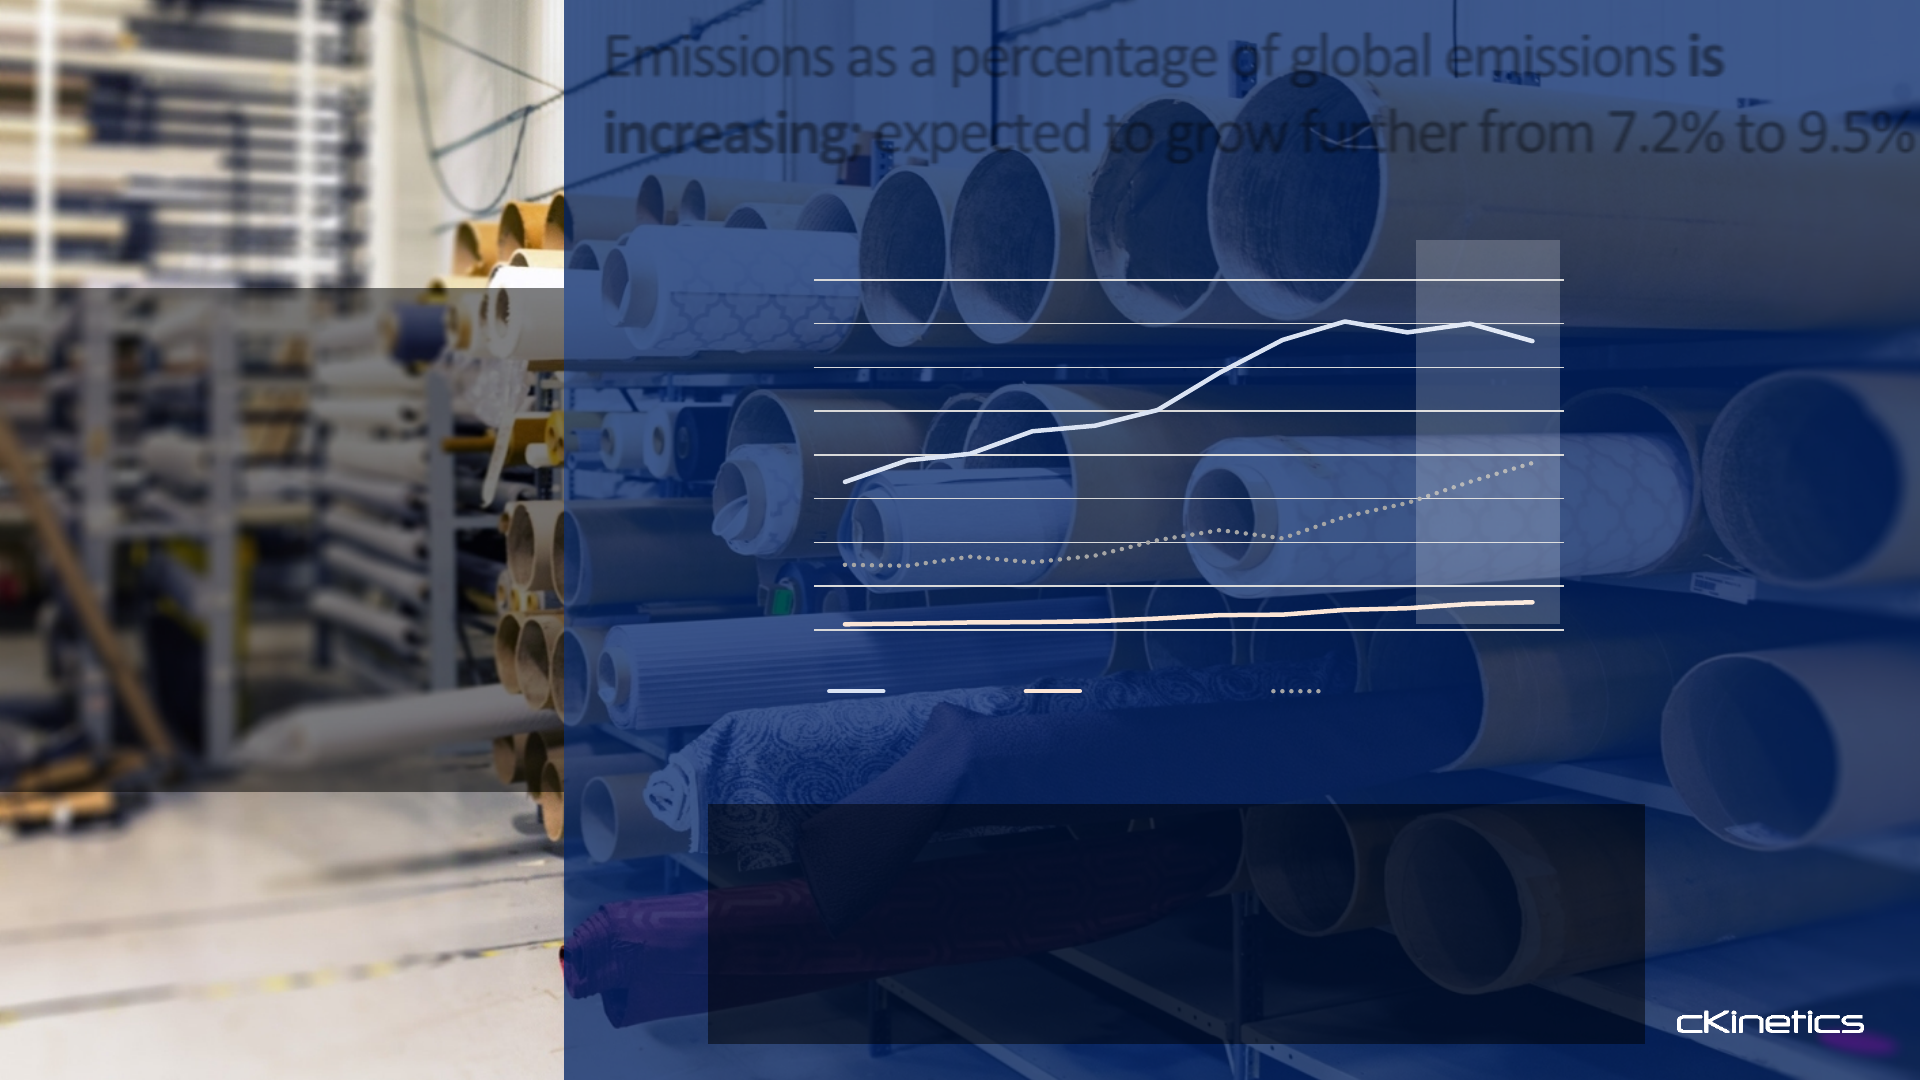
Global Emissions Textile sector Emissions Textile sector contribution
Global GHG emissions level increased by 26 % in
the last decade whereas the GHG emissions level
due to textile sector increase by 42% in the last
decade.
In the upcoming ‘decisive’ decade of the climate
change fight, the global emissions are expected to
increase by 5% while the emissions due to textile
sector are expected to increase by 30% during the
same time period.
Textile and Apparel sector contributed to 5.23% of
total global GHG emissions in 2010 which increased
to 7.25% in 2020. The share of textile sector
emissions is expected to reach 9.5% in global GHG
emissions by 2030 (this factors the known emission
reduction plans).
Emissions as a percentage of global emissions is
increasing; expected to grow further from 7.2% to 9.5%
9.5%
ofglobalemissionswillbe
fromthissector
Projected
Source:GlobalEmissionstill2020fromEPA,TextileandApparelsectordatafromcKineticscomMITdatabase,cKinetics
projections
Global GHG Emissions and Textile Sector Emissions
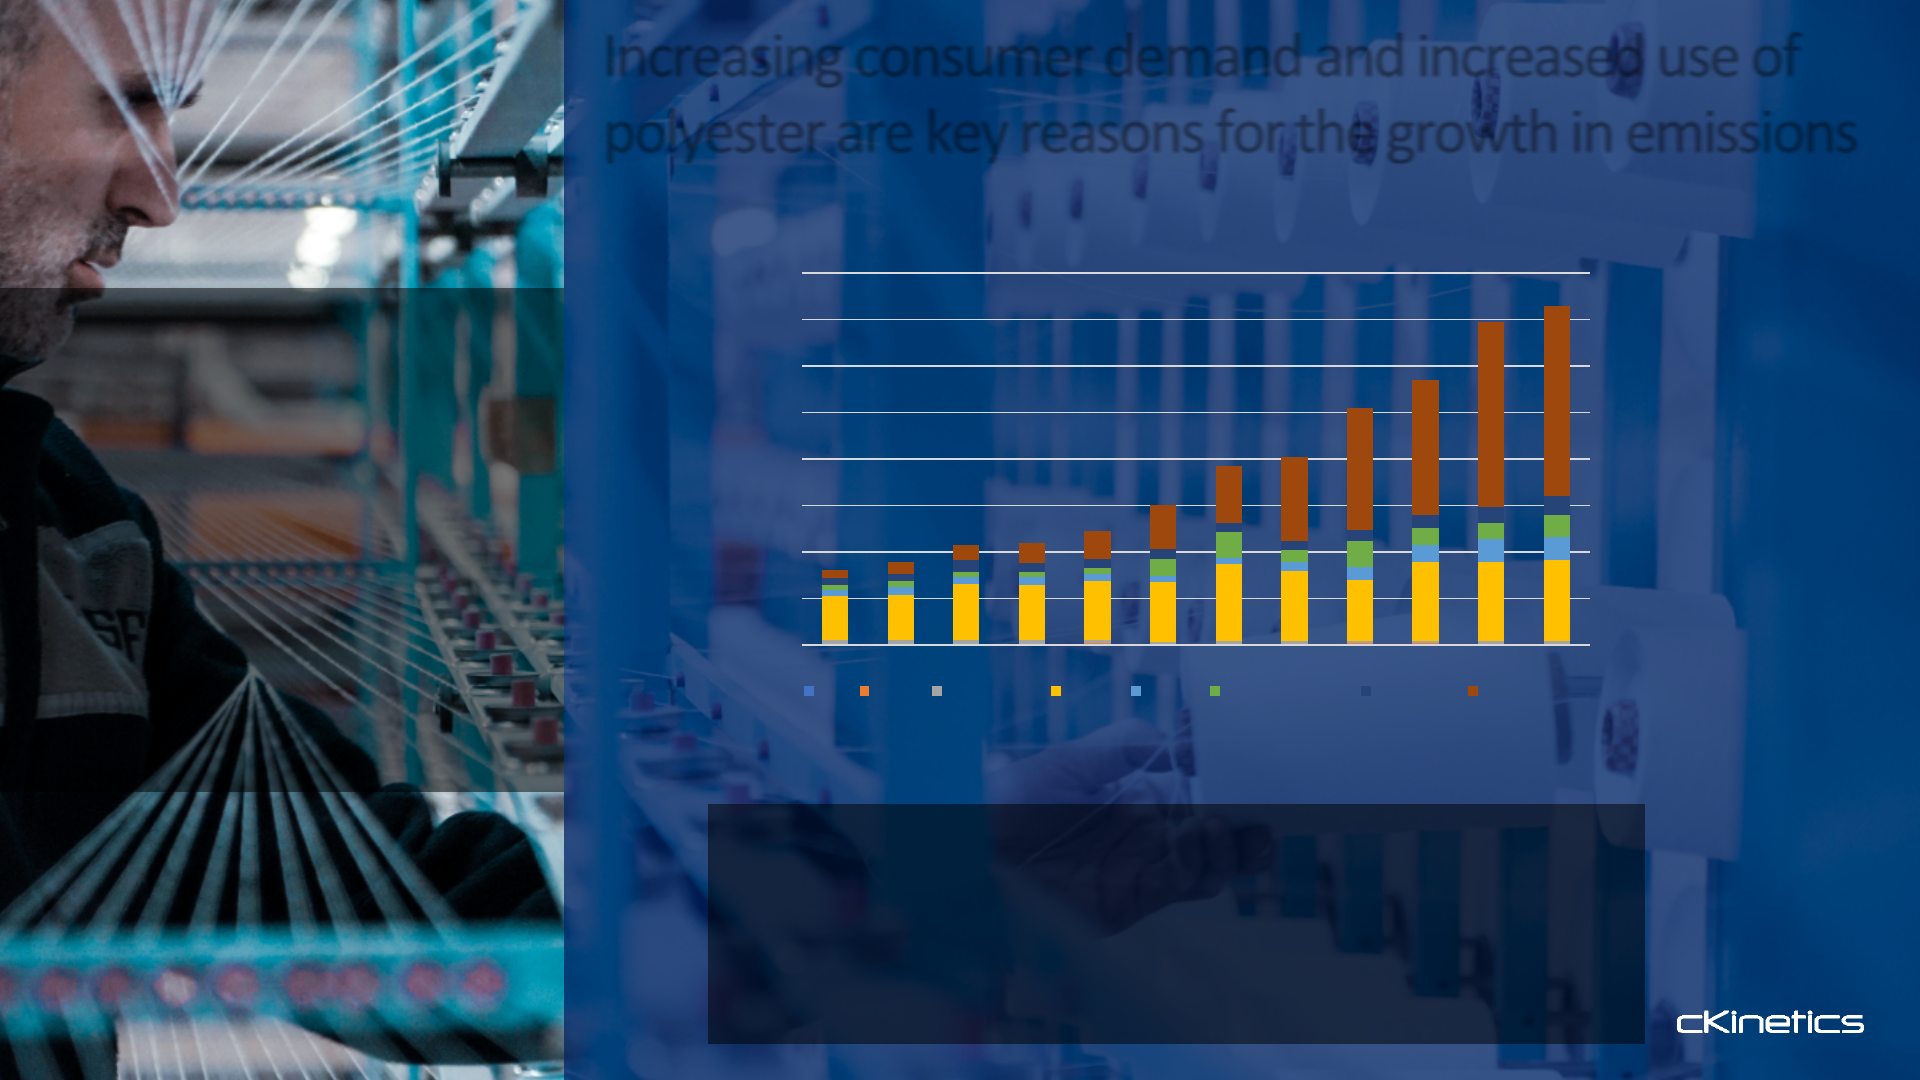
Our demand for textile and apparel products
continues unabated.
To feed that demand, global fiber production
increased 40% in the last decade whereas the
production of polyester increased by 60% at the
same time. Polyester has emerged as the most
preferred fiber because of its low price, versatility,
physical propertied and recyclability.
Global fiber production is expected to increase by
28% (from 2020 levels) by the end of this decade
while the polyester production in expected to
increase by 41% (from 2020 levels) by 2030.
The production of polyester caused 710 million
tons of GHG emissions which was 24% of the total
emissions due to textile sector in 2020.
Increasing consumer demand and increased use of
polyester are key reasons for the growth in emissions
3.1%
Annualizedhistorical
growthrateofdemand
1975 1980 1985 1990 1995 2000 2005 2010 2015 2020 2025 2030
0
20
40
60
80
100
120
140
160
Silk Down Wool Sheep Cotton MMCF Other synthetics Polyamide Polyester
Global Production of Fibers (Million Tons)
Source:TextileExchange.(2020).PreferredFiberandMaterialMarketReport2020
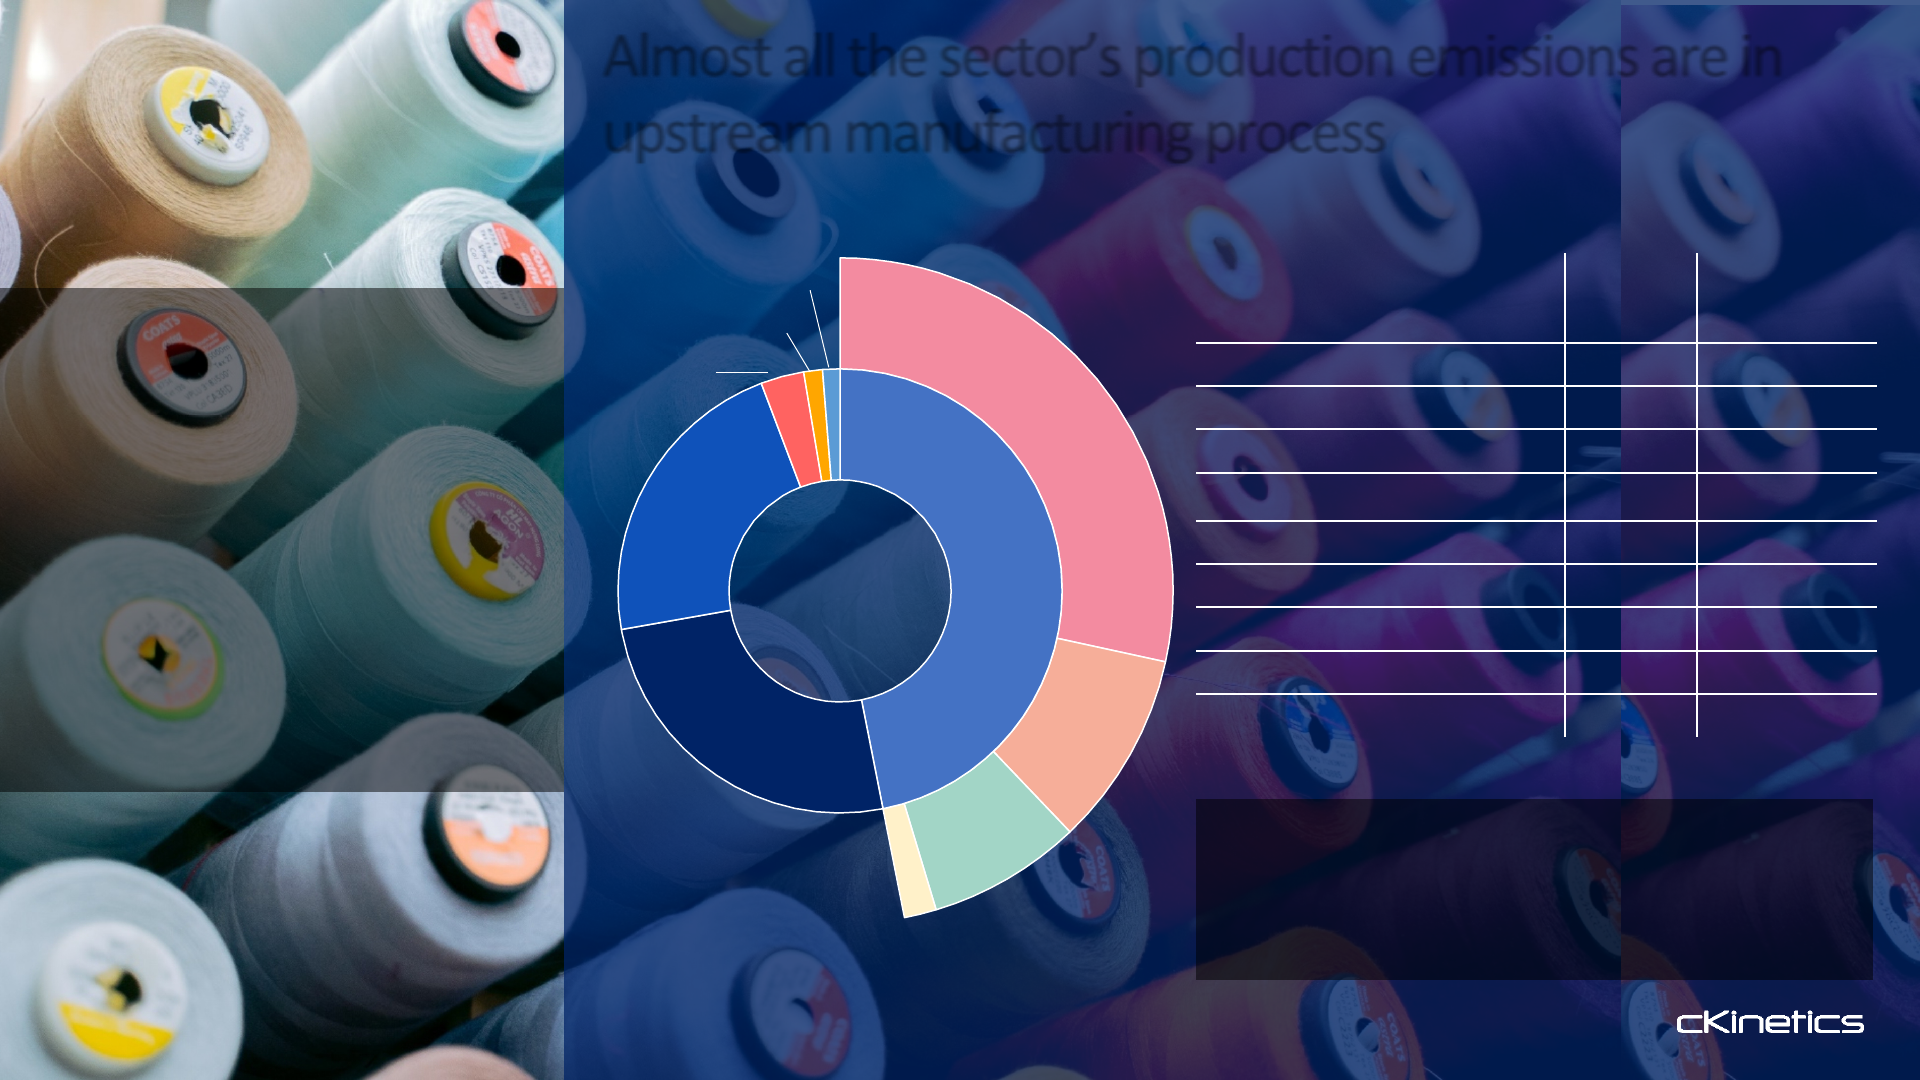
Almost all the sector’s production emissions are in
upstream manufacturing process
92%
oftheemissionscomefrom
upstreamprocesses
Polyester
Cotton
Otherfibers
MMCF
Fiber
Fabric
Production
YarnConversion
CutSew
Emissions
(Million
tons CO2e)
Percentage
Polyester Production 710
28.4%
Cotton Production 236
9. 5%
MMCF Production 39
1. 6%
Other Fiber Production 187
7.5%
Yarn Conversion 510
22.0%
Fabric Production 633
25.3%
Cut Sew 79
3.2%
Apparel brands logistics and selling 34
1.4%
Other textiles logistics and selling 32
1.3%
2.5 Billion
TonsofCO
2
Eq
cKinetics estimates for the different
manufacturing process are based
on a study conducted in 2021
The team estimated the quantity of
material as they go through the
different processes: constructing a
mass-flow.
Subsequently, the most recent
emission factors were applied for
each process. These factors were
determined by studying the
emissions of ‘pure-play’ firms in
that space.
Emissions for different processes
CutSewMake
Apparelbrands
Othertextiles
Source:cKineticsresearch,cKineticscomMITdatabase
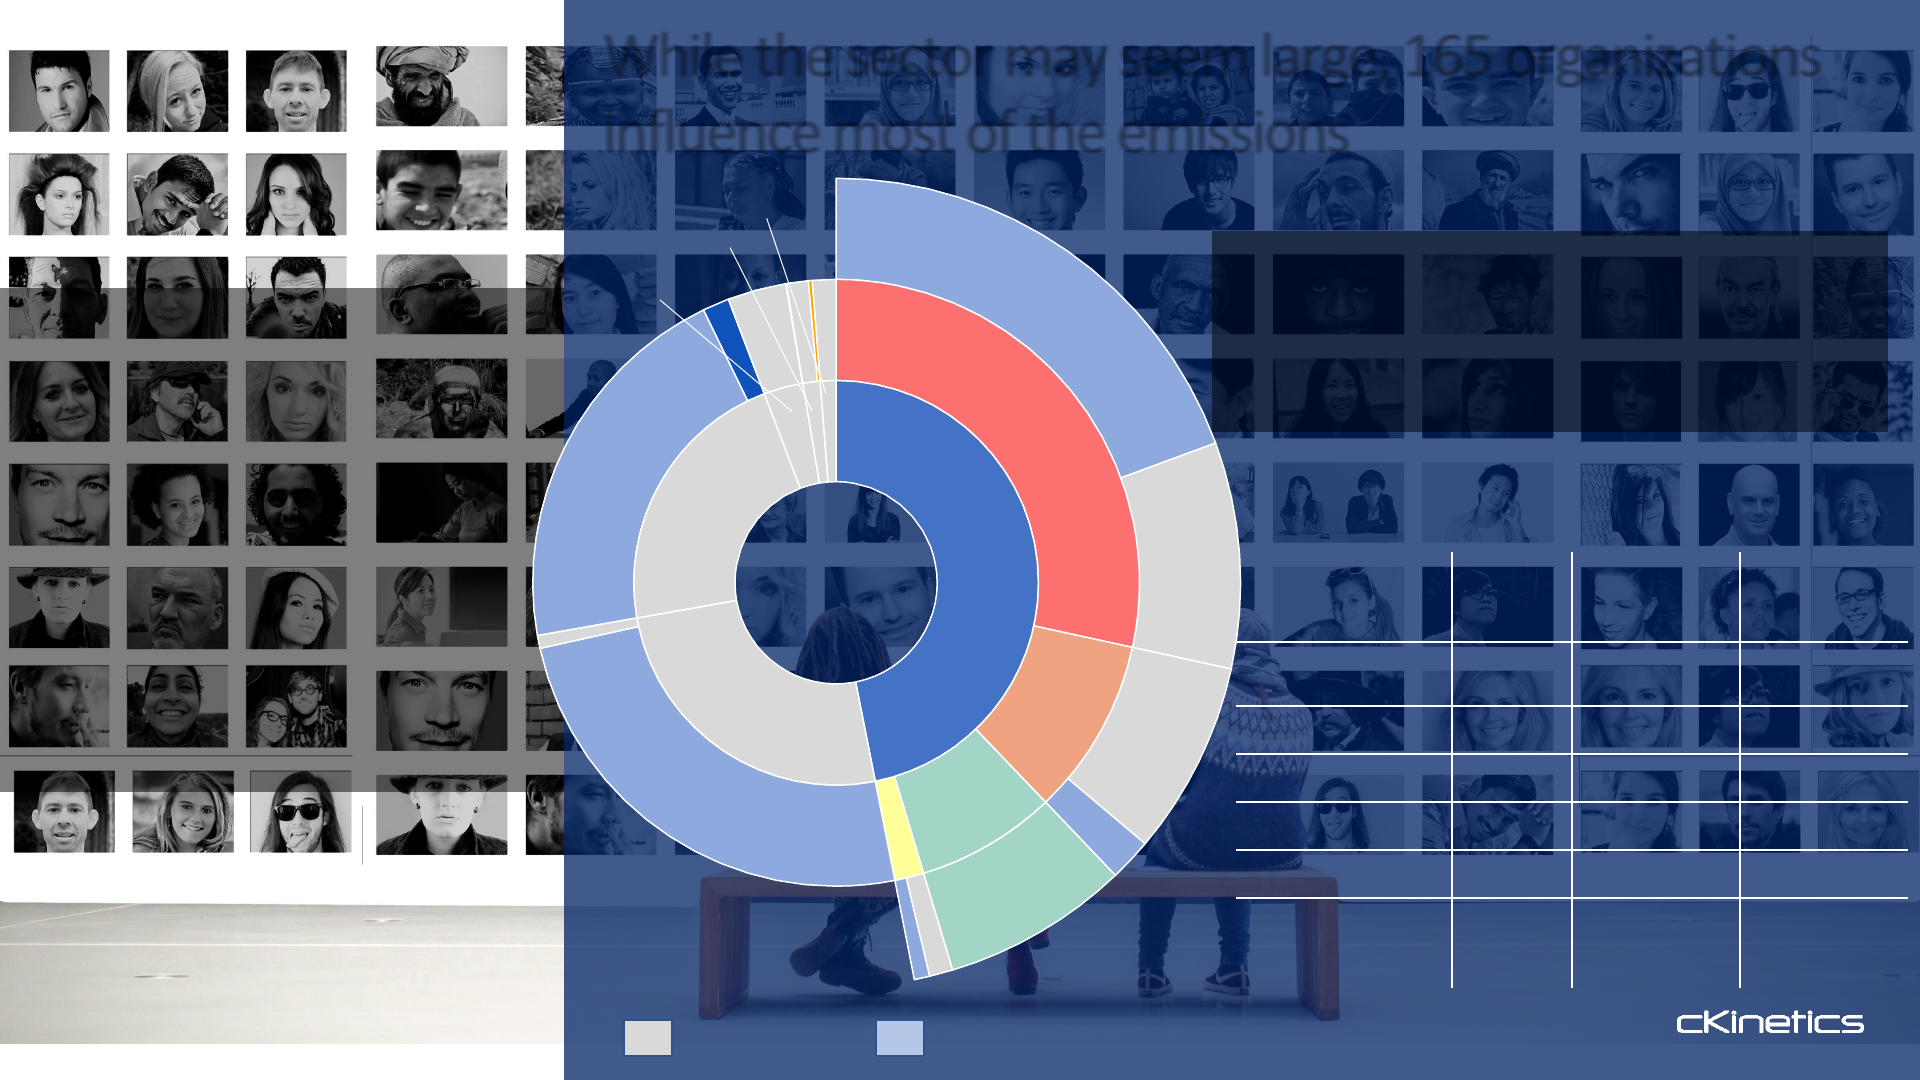
While the sector may seem large, 165 organizations
influence most of the emissions
2.5 Billion
TonsofCO
2
Eq
165
Companiescontrol24%of
theemissions
Traced
Untraced
Polyester
Cotton
Other fibers
Untraced
Untraced
Untraced
Fiber
Untraced Traced emissions
cKinetics analyzed the sources of
emissions of each of the production
processes, by identifying key firms
and researching their emissions.
Key firms are those that are a
significant in the process – from a
production volume standpoint and/
or from their influence on the
emissions in that stage.
The 165 companies identified span
the globe and are listed at the end
of this briefing.
CutSewMake
Apparelbrands
Othertextiles
Process Key firms Emissions
(Million tons of
CO
2
eq )
% process
emissions
traced
Polyester Production 19 484.5 68.2 %
MMCF Production 7 23.6 68.5 %
Cotton Production 12 42.6 18.1 %
Yarn Conversion 32 35.5 6.5 %
Fabric Production 66 23.8 3.8 %
Textile/ Apparel
Brand and Retailers –
logistics and selling
29 7.1 11.9 %
Emissions that were traced
Source:cKineticsresearch,cKineticscomMITdatabase
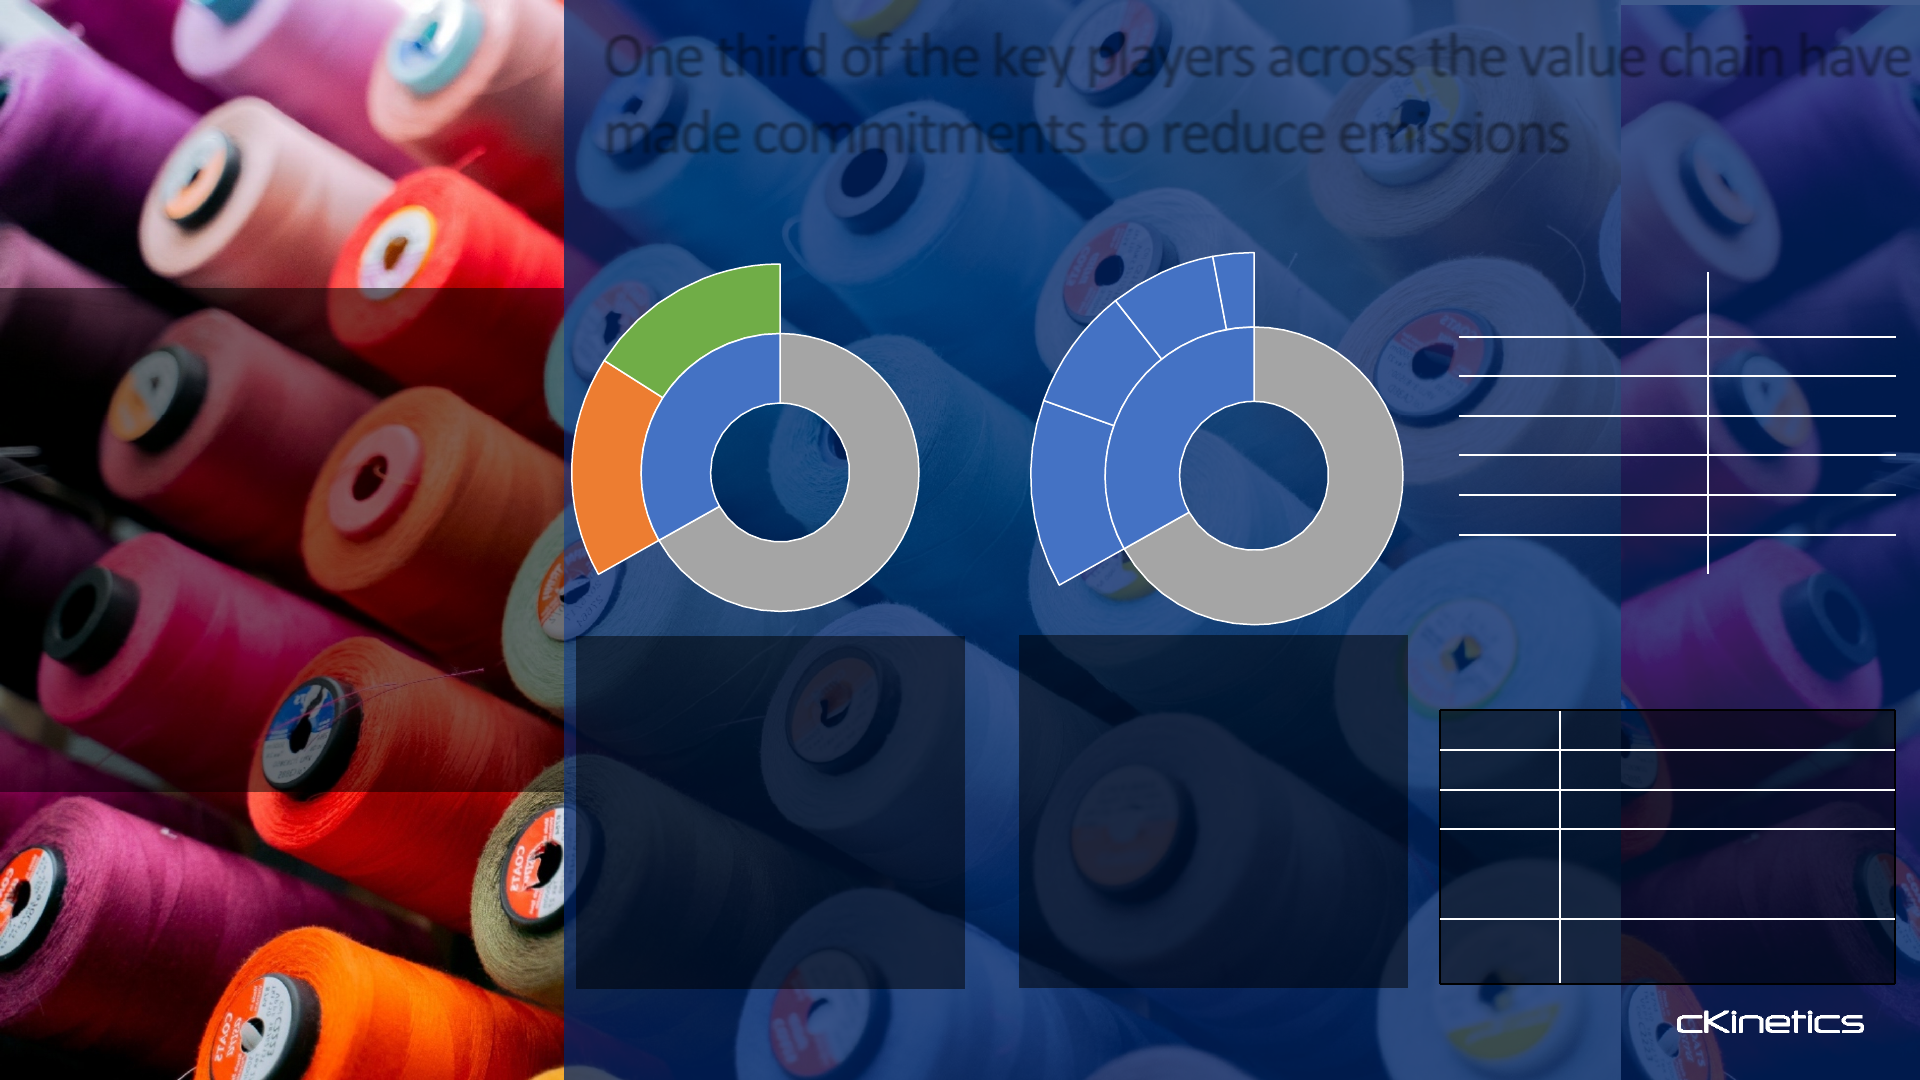
One third of the key players across the value chain have
made commitments to reduce emissions
56
of165organizationshave
emissionreductionplans
Number of key
firms with targets
Polyester Production 2
MMCF Production 6
Cotton Production 6
Yarn Conversion 2
Fabric Production 12
Brands and Retailers 28
Brands All major brands and retailers
Yarn Toray Industries, Aditya Birla yarn
Cotton Olam and Glencore agriculture
MMCF
Birla Cellulose, Zalando SE,
Eastman Chemical, Kelheim Fibers,
Lenzing and Sateri Holdings
Polyester
Reliance Industries and SiNopec
Yizheng Chemical Fiber
SBTI, 29
Others,
27
No
Target
Target
Absolute,
23
Both, 15
Iintensity,
13
Other, 5
No Target
Target
Over the last few years, many
organizations have committed to
emission reduction goals. The textile and
apparel sector is no exception.
Science Based Target Initiative (SBTi) is
the most commonly adopted framework
for goal setting.
In addition many organizations have
communicated emission reduction goals
in their annual plans and sustainability
reports (classified as others in the chart).
These are part of their communication/
commitments to investors or to meet
their respective national mandates.
Framework for goal setting Types of goals set
The key organizations have set a mix of
goals to reduce emissions. Absolute goals
are those where the organization
commits to reduce a fixed amount of
emissions. Intensity based goals are
where the emission reductions are linked
to either production or revenue. Some
organizations have both absolute and
emission goals.
56 have emission targets by 2030
30 out of the 56 have net-zero
goals by 2050

Even if all current emission reduction commitments are
met, overall sector emissions are expected to grow
40%
emissionreductions
neededby2030isunlikely
basedonpresenttrajectory
Emissions if the key orgs met their reduction goals
641
Thekeyplayersrepresent
astartingpoint
It is likely that more of the key players (beyond the 56) will
set emission reduction goals in the coming years. The harder
task will be in implementing those plans.
However, even if the existing plans known are met, the
emissions of the key players will fall from 641 million tons of
CO2eq to 580 over this decade: a drop of 9.6%. This factors
the growth of production anticipated in the same time
frame.
Willthisbecomeahard-to-
abatesector?
40% greenhouse reduction by 2030 (from 2020 levels) is
what is needed at a global level to meet climate goals.
The trajectory of the textile and apparel sector is such that
emissions could grow from 2.5 billion tons CO2e (current) to
3.1 billion tons CO2e by 2030. Rather than contribute to a
decrease in emissions, this sector is likely to increase.
The reduction initiated by the key players will have to be
followed by changes throughout the sector. This decade is
crucial.
Emissions in 2019
(Million T CO2 eq)
Emissions in 2030
(Million T CO2 eq)
580

But, there are also some tailwinds that could accelerate
decarbonization of the sector
6
Levers,thatleadersinthe
sectorscantakeadvantage
ofinthenearterm
Nationalmandates
emerging
Several jurisdiction are framing pathways for
emissions reductions into law:
• 17 countries have incorporated net-zero
goals into law
• 27 countries have made pledges and 5
have policy development underway
These can drive / accelerate manufacturer
investment plans to adopt clean technologies.
Emergingconsumer
awareness
Consumers have been slow to engage.
However, increasingly surveys are showing
that Gen Z (1997-2012) especially in North
America and Europe are growing up believing
Climate Change to be an existential threat.
It remains to be seen how that translates into
purchase decisions as they come into their
earning years.
Greeningelectricity
grid-30%impact
Many countries across the globe are aiming
for a zero emission grid by the mid-century.
As electricity gets decarbonized so will yarn
conversion and parts of fabric production
(about 30% of the sector’s emissions).
If electricity becomes green and inexpensive,
it could also pave the way for large scale heat
-pump adoption in fabric production.
Reducingimpactof
fibers
Preferred fibers are gaining traction: from
recycled polyester to better cotton. Recycled
materials are becoming more available.
Additionally, key polyester and MMCF
manufacturers are making plans to go carbon
neutral.
Fiber choices will be crucial in determining
the pathway for the sector.
Alternatefuelsin
selectregions
Half the energy consumed in fabric
production is thermal energy. Presently that
is a significant source of emissions as fossil
fuels are used.
In select regions there is a move towards
cleaner bio-based fuels: renewable natural
gas, biomass, etc.
Carbonmarketsand
climatefinance
The last few years have seen:
• Investors adopting ESG principles,
requiring their investments to address
climate issues
• Emergence of ‘green’ lines of capital
seeking to invest in green projects.
• Carbon markets are re-emerging, that
form potential revenue streams for
alternate fuels/ green tech

Methodology
Methodology and Data sets used
Mass-flowtraced
acrossthesector
The research supporting this briefing is based on
developing (and tracing) the mass flow from the
time a fiber is produced to the time a product is
manufactured.
There were two components that were
reconciled:
1. Top-down view on the ‘expected mass’ that
ought to be there in the different production
processes. The starting point here is the fiber
produced annually and projecting it across the
various processes.
2. A bottom-up view to trace the ‘actual mass’
based on tabulating the production and capacity
of the manufacturing facilities / companies.
This provided a granular view on details like
location, production efficiency and latest
emission factor.
Using #1 and #2, a mass-balance was constructed
for the different processes and for the overall
textile and apparel ecosystem. This helped
determine areas where there was sufficient
information to make informed projections (high
confidence); and areas where the estimations in
the projections have higher variance (lower
confidence). Overall, the analysis presented in
this briefing note, takes the data points where
confidence on accuracy is high.
Datasourcesand
extrapolations
The following core data-sets have been used:
1. Company public disclosures – annual reports,
sustainability reports, press releases
2. Fiber data- from Textile Exchange, UN
Comtrade Database, Regional Export Promotion
Councils
3. Commitments presented on SBTi and reduction
plans from CDP
4. Emission factors from the cKinetics comMIT
database
Determining current emissions of companies
Where companies provided the information on
emissions, that was used directly.
In cases, where the textile/ apparel sector
operations were part of a larger conglomerate or
where information was not disclosed, the
emissions were estimated by using either the
production or revenue; and applying the relevant
emission factor for the process.
Estimating future emissions (by 2030 and 2050)
Where companies have stated goals for 2030
and/or 2050 emissions, those were used directly.
Where companies had goals for 2025 or beyond,
those goals were extrapolated.
In both case, the production was assumed to
increase at the industry growth rate.
Companyprofiles
developed
In addition to looking at the goals, the emission
reduction plans for each of the companies were
enumerated.
This helped establish confidence on goals at a
company level. That was done by comparing the
reduction plans with:
1. the best-available-techniques in the process/
industry
2. the peer group within that industry to
understand further scope that may exist in a
company or in a sector
Presently work is under-way to compile this
analysis and make it available to clients. It will be
provided as part of cKinetics’ comMIT database.

Organizations
Key organizations analyzed and profiled
Textile/ Apparel Retailers and
Brands
Adidas
ASICSCorporation
AuchanHolding
BurberryLimited
Decathlon
FASTRETAILING
GapInc.
Guess,Inc.
H&MHennes&MauritzAB
IKEA
Inditex
Kering
LeviStrauss&
LojasRennerS.A.
lululemon
LVMH
Marks&Spencer
NIKE,Inc.
PUMASE
PVHCorp.
TargetCorporation
TJMaxx(TJXcompanies)
VFCorporation
Walmart
Cotton sourcing
ADMCotton
Bunge
Cargill
CofcoIntl
Ecomtrading
GlencoreAgriculture
LouisDreyfus
NamoiCotton
Olam
Omnicotton
MMCF production
BirlaCellulose
CelaneseCorporation
DaicelCorporation
EastmanChemicalCompany
FormosaChemicals&Fiber
IndoramaVentures
KelheimFibresGmbH
LenzingAG
SateriHoldingsLimited
ShandongYamei
SilverHawk
TangshanSanyou
XinjiangZhongtaiTextileLtd
YibinGrace
Polyester Production
Alpek
AsiaPacificfibers
BillionIndustrial
BombayDyeing
FarEasternNewCentury
FujianJinlun
HengliGroup
Huvis
JiangsuSanfangxiangGroup
LealeaGroup
MitsuiChemicals
NanYa
NingboDafa
Reliance
RongshengPetroChemical
SiNopecYizhengChemical
Fibre
TongkunGroup
TorayIndustries
WilliamBarnet&Son(Limited
Liabilitycompany)
XinFengMingGroup
ZhejiangGuXianDaoIndustrial
Fiber
ZhejiangHengyiGroup
Material Conversion
AdityaBirlaYarn
AdvanceDenimLimited
AksaAkrilikKimyaSanayiiA.S.
AlokIndustriesLimited
AmberTextileMills
AnhuiAnliMaterial
TechNology
ArtisticGroup
ArvindLtd
AsahiKaseiCorporation
BestPacificTextile
BeyteksTekstil
BillionRiseKnitting
BlackPeony
BondexInt'L
BrimadonaIndustrialCoLtd
BrosTextile
CalikDenimTekstilSanayiVe
Ticaret
ChiaoHwaIndustry
Color&TouchCo
CrescentTextileMills
DeLicacyIndustrialCo
DollarIndustries
EagleNice(International)
Holdings
EclatTextileCo
ErdemTekstil
EsquelEnterprisesLtd
EverestTextile
FareastCorp
Feroze1888MillsLimited
FormosaTaffetaCo
FountainSet(Holdings)
Limited
FountainSetLimited
FulltechFiberGlassCorp.
GadoonTextiles
GarwareTechnicalFibres
Limited
GratefulTextileCo
HWearTextiles
HimatsingkaSeideLimited.
HongdaHigh-TechHolding,
Huafufashion
HuafuGroup
HyosungCorporation
IbrahimFibresLimited
IlshinSpinning
IndahJayaTextile
IndoCountIndustriesLimited
Interloop
IsraqSpinningMills
JiangsuGuotaiInternational
GroupHualianIndustry
JiangsuLianfaImp&Exp
JiangsuLianfaTextile
JiangsuLugangCulture
JindalWorldwideLimited
Jungwoovina
KamHingInternational
Holdings
KamaHoldingsLimited
KewalKiranClothingLimited
KingdomHoldingsLimited
KOLONMATERIALS
KPRMills
LanFaTextile
Li-ChengEnterprise
LuThaiTextile
M.L.Dyeing
MahmoodTextileMills
MarzottoSpA(Italy)
MenderesTekstilSanayive
TicaretANonimSirketi
NewWide(Hk)Int'LCo
NiceDyeingFactory
NienHsingTextile
NishatMills
NomanTextilesMillsLtd
OrtaAnadoluTicaretVe
SanayiIsletmesiT.A.S.
P.TKahatex
PacificTextilesHoldings
Limited
PageIndustriesLimited
ParamountTextile
PFNonwovensa.s.
PTPolychemIndonesiaTbk
PTTificoFiberIndonesia
PtWinTextile
RaymondLimited
RecronMalaysiaSdnBhd
ReginaMiracleInternational
Riopele
Rupa&
SOneTextile
SaebanTextileCo
SankoPazarlamaIthalat
IhracatANonimSirketi
SankoTextile
SapphireTextileMills
SewangTextileCo
ShanghaiTiqiaoTextile
SnsFashion
SoenmezPamukluSanayii
ANonimSirketi
SportkingIndia
SquareTextiles
SritexIndonesia
TaihanTextile
TainanSpinning
TaiwanPaiho
TatFungTextileCo
TexhongTextileGroup
Tex-RayIndustrial
TexwincaHoldingsLimited
ThaiPolyesterCompany
Limited
ThaiWacoalPublic
TopSportsTextileLimited
TridentGroup
UniversalIncorporation
VakkoTekstilveHazirGiyim
SanayiIsletmeleriA.S.
VardhamanTextiles
VishalFabrics
WeiqiaoTextileCompany
Limited
Welspun
Winnitex
XingyeLeatherTechNology
XinlongHolding(Group)
YakjinIntertex
YoungTextile
ZheJiangJasanHoldingGroup
ZhejiangSaintyearTextile
ZhejiangTaihuaNewMaterial
ZhejiangXinaoTextilesInc
ZigShengInd

Contact
To learn more about the study or the analysis, contact:
Pawan Mehra, Managing Director
Rekha Rawat, Director, Sustainable Industries
Projects+SBT@cKinetics.com
www.cKinetics.com
Cupertino, California, USA
New Delhi, India